
Popular culture has always used equity investment interchangeably with gambling / speculation. This has come about due to two reasons- easy entry/exit (liquidity) availability through the stock markets and daily movement of prices. Both these factors are unavailable with any other asset class and prompt equity investors to take quick decisions thereby abetting trading/speculation. The cacophony created by the media adds to confusion of the lay investor, finally causing more harm than good.
We are of the strong belief that in the case of investments long/ short term is a misnomer. Most investors confuse its definition with the one provided by the Income Tax Department (>1yr long term, <1yr short term). Investments should instead be viewed more holistically. All asset classes go through a well-defined cycle, the length of which will depend on various macro and micro factors. While real estate is generally considered to undergo a 10-15 year cycle from boom to bust, Equity investments move from crest to trough over a period of 5-7 years.
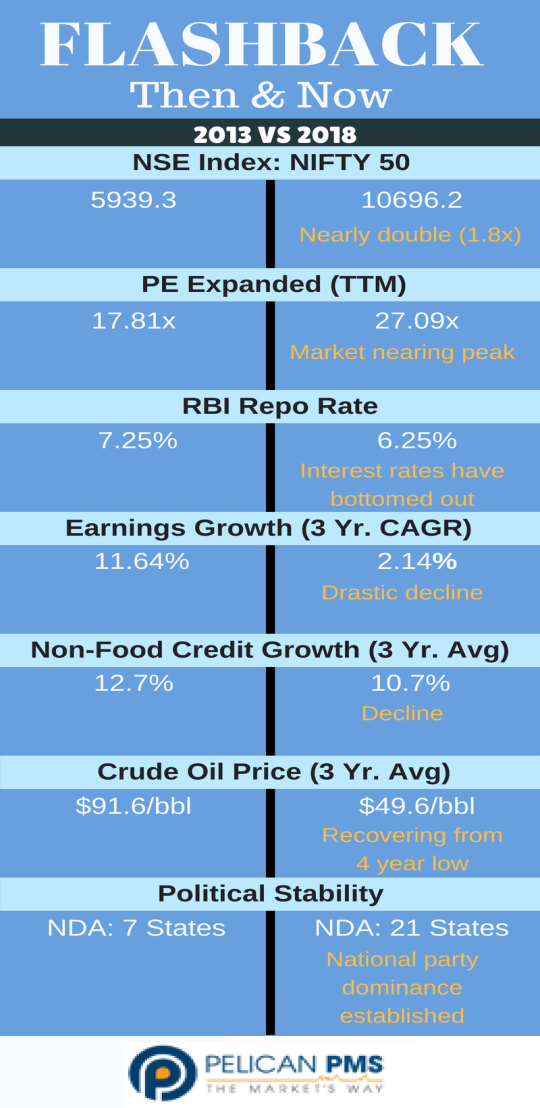
In the case of Equity investments, Price Earnings (PE) is a simple and powerful tool that could be used to gauge the status of the Equity Life Cycle (ELC). The movement of PE happens due to both change in Price (P) and change in Earnings (E). In a rising PE scenario, the sentiment is positive and is reflected in the higher prices and supported by earnings growth. However as the prices start to move faster than the earnings there is PE expansion and eventually a bubble scenario. The bubble bursts when the prices are no longer justifiable to the earnings offered. This would be the end of the ELC. On the corollary, as the PE reduces, the earnings cushion the prices up until the discount becomes too high and attractive indicating an end to the sell off and beginning of a new ELC.
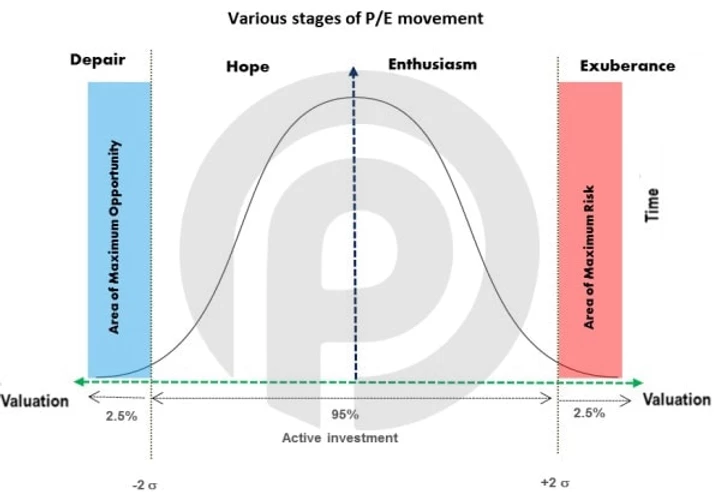
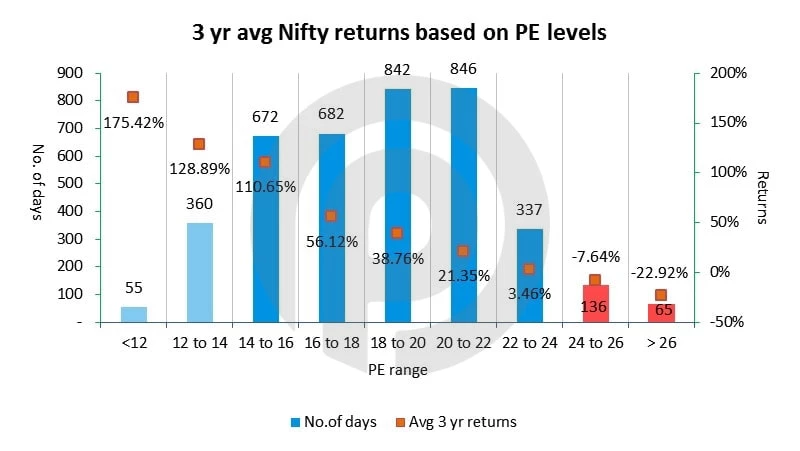
Mapping the PE over a period, would indicate the ELC range. For a given fundamental scenario, price moves up and down based on factors like risk appetite, liquidity, macro risk and other similar systematic reasons which are not diversifiable and therefore the need to provide for standard deviation based levels. Statistically, the range between +/- 2s (standard deviation) from the rolling Mean PE is where 95% of the trading takes place. Breaking this range above (Euphoric) or below (Despondency) is generally an outlier event and continues only for a short period before returning back within the range. Investment returns are maximized when timed near the lower band of the ELC.
What do you MEAN?
Another concept that warrants attention here is that of “Mean reversion”- over a period of time any abnormal activity will eventually revert to the Mean or Normal. It is a concept that is well researched and practiced in different formats across the world and for different reasons. In the stock market parlance researchers investigate and predict price movement using multiple tools. Fundamental analysis value mispriced stocks on the expectation that earnings, margins, growth rates will move towards the sector average, and depending on the anticipated change a buy or sell recommendation is provided. In the case of technical analysis over bought and over sold decisions are taken based on the variance from the Mean. Even in the case of Behavioral studies the analysis of the herd (mean) is considered most important.
For practical actionable purposes, mean reversion can be visualized in two ways- Firstly, across a time series, where the parameter under study has deviated from its long term average and currently trades either above or below. This can provide reason to either enter or exit (timing) the markets. Secondly, on a cross- sectional basis, a set of similar companies are placed against each other for comparison. Stocks can be selected (stock picking) using this method by gauging the variance from the group mean.
While this process might sound simple at the outset there are a few caveats. Reversion cannot be timed and in the famous words of Keynes “ The market may remain irrational for a longer period than you can remain solvent”. Structural and technological changes in the market or sector can cause permanent shifting of the mean and impede reversion all together. Finally the time period of data under consideration and the parameter for study are totally subjective. Hence long periods of data may be irrelevant to the study as situations might have changed over time thus resulting in a higher or lower Mean value. Parameters such as Mean PE, PBV, ROE encompass most of the market fundamentals or sentiments hence are better indicators to arrive at investment decisions.
Our investment strategy marries the concept of Dynamic Mean reversion with our understanding of the Equity Life cycle. It doesn’t involve predicting the time line of the ELC nor the return to normal as we are cognizant of the fact that it is a futile attempt. Instead we invest schematically phasing out our cash allocation at pre-defined levels provided by the Mean PE, thereby protecting our capital and capping our downside risks. We call it the “Fair Winds and Following Seas Approach” wherein Investors achieve their objective by simply moving along with the cycle. We invest in a concentrated portfolio of Large cap market leaders. While our Large cap exposure reduces the unsystematic risk, the concentrated nature of the portfolio enhances the risk adjusted performance both during bull as well as bear markets. Further it also avoids several un-defined risks that may arise while trying to identify small/mid cap stories (identifying tomorrow’s Unicorns approach!). Risk of Research failure is often a less acknowledged fact!
In conclusion, we strongly believe, by reducing the element of subjectivity and investing based on what the market offers is a much easier and effective approach to investment management. Investors with good temperament and clear understanding of economic cycles will merit this approach for long term capital building.